In recent weeks I’ve opted for the contrarian position that is cash in significant size. Not calling a top or anything like that, just not smart enough for that, but I do think there is a lot of craziness going on in the markets that calls for at least some degree of caution.
Short interest is low:

Margin buying is high:

Insider selling is high:

On top of that you have rampant speculation in SPACs and stocks like Tesla that has 20x’ed in 18 months to a valuation exceeding $800 billion. If that story unravels how would it impact the general market? Is it possible to imagine there not being some sort of ripple effect?
It is said that valuation doesn’t matter anymore, to which the proper response throughout market history has always been: “Until it does”.
To me it seems like investors are loaded on one side of the boat and that the market is priced close to perfection. Ergo the market could be in a more fragile state than is generally perceived.
Since a dollar saved is more valuable to me than a dollar won I want outrageous value propositions, ie. absurdly low valuations. And I’m just not finding as many of those in the corners of the market that I spend my time. In many of those sectors the stocks have risen sharply while the fundamental picture is less clear. Which makes me err on the side of caution and trim positions where I think the risk/reward is still attractive but less so than a few months ago while exiting others.
Oil
In oil I am seeing a different picture. Fundamentals have recovered but the stocks much less so.
This is a supply story more so than a demand one – despite the media focus on the latter (“peak oil”, “electrification will eat the world tomorrow”, etc.).
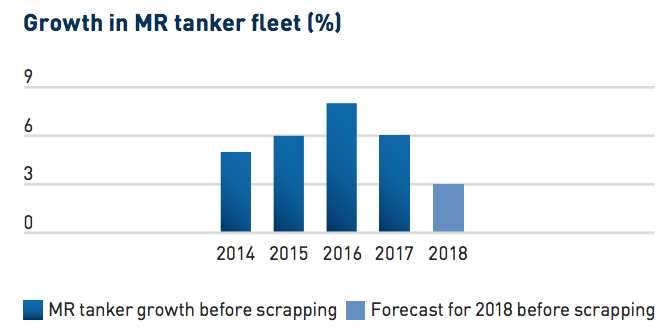
The oil majors have been cutting their capital expenditure budgets since 2014 which has led to underinvestment and a drawdown of reserves and the virus has accelerated that trend. This could lead to a squeeze in a few years time.
A number of the oil majors are cleaning up their image by moving towards renewable energy. Strangely many investors see this as a sign to exit oil stocks. What I suspect some are failing to see is that when supply takes a hit you want to be a buyer of that commodity, not a seller.
You would think investment activity would pick up to make up for those lost years, especially as oil prices are increasing. However, so far that is not happening. On Q4 conference calls with US shale producers the mantra is “debt reduction and returning capital to shareholders”. What you don’t hear is the word “growth”. And even if US producers wanted to expand it is doubtful that they are even able to make such a decision after 10 years straight of negative free cash flow.

Both lenders and investors want to see cash returned rather than entering into new adventures. On top of that ESG comes more and more into the thinking of banks, putting yet more pressure on the idea of growth.
And I think one of the big changes that may have been missed by some parts of the market is the ramped up frequency of OPEC meetings that are now on a monthly basis. This can be seen as a veiled threat to US shale producers: “We are keeping a very close eye on what you are doing and if we see any sign of significant increase in your drilling activities we may respond by dropping more oil on the market leading to lower prices making your capital investments very risky. So don’t do it! Keep doing what you are doing now (ie. hold back on your investments) so that we may all prosper.”
Naturally there are many ways to play the thesis depending on one’s tolerance for risk. Personally my largest exposure in the sector is with International Petroleum.
International Petroleum
Lundin Energy is a famous 200-bagger if you bought the stock in 2001 and include dividends. In fact, today’s quarterly dividend alone is higher than what you paid for the stock back then! A lot of luck involved in being on the right side of the commodity cycle of course but I imagine skill is part of the story as well.

In 2017 Lundin Energy spun-off their non-Norwegian assets into a new company called International Petroleum, ticker symbol IPCO. And with it some key management people. Among others the CFO, Mike Nicholson, who became IPCO’s CEO. And the former CEO for more than 13 years, Ashley Heppenstall, became Chairman of the board of the new company. Both have decent amounts of shares in IPCO and both have bought more at various points in time.
The intention was for the company to take Lundin Energy’s mature and declining assets in Malaysia and France and use the cash flow from those to expand opportunistically into new non-Norwegian areas and leave those for Lundin Energy. Since then the company has made three acquisitions of oil and gas assets in the Canadian oil sands. 75% of their assets are in Canada. And of those Canadian assets 25% is gas and the rest oil. This means that roughly 60% of their revenue depends on the price of Western Canadian Select, WCS, while Brent oil makes up 15%-20% of the revenue. Gas is doing very well currently and IPCO has hedged most of 2021 at decent prices compared to historical averages.
Because of sub-optimal pipeline infrastructure in Canada transporting oil from there to the US has historically been an issue, which is the main reason why WCS always trades at discounts compared to Brent and WTI oil. The discount has narrowed recently and pipeline expansions are expected to come online within a couple of years. (Note, the WTI/WCS differential is currently significantly lower than what IPCO has assumed in their price decks, leading to conservative estimates)
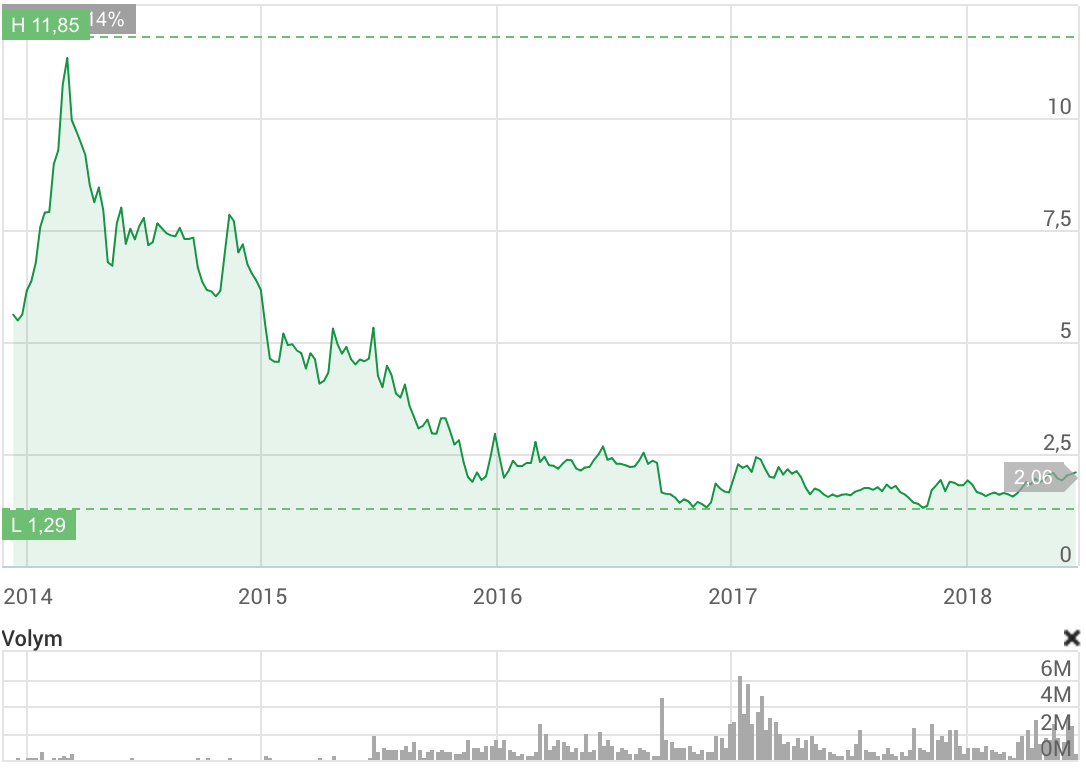
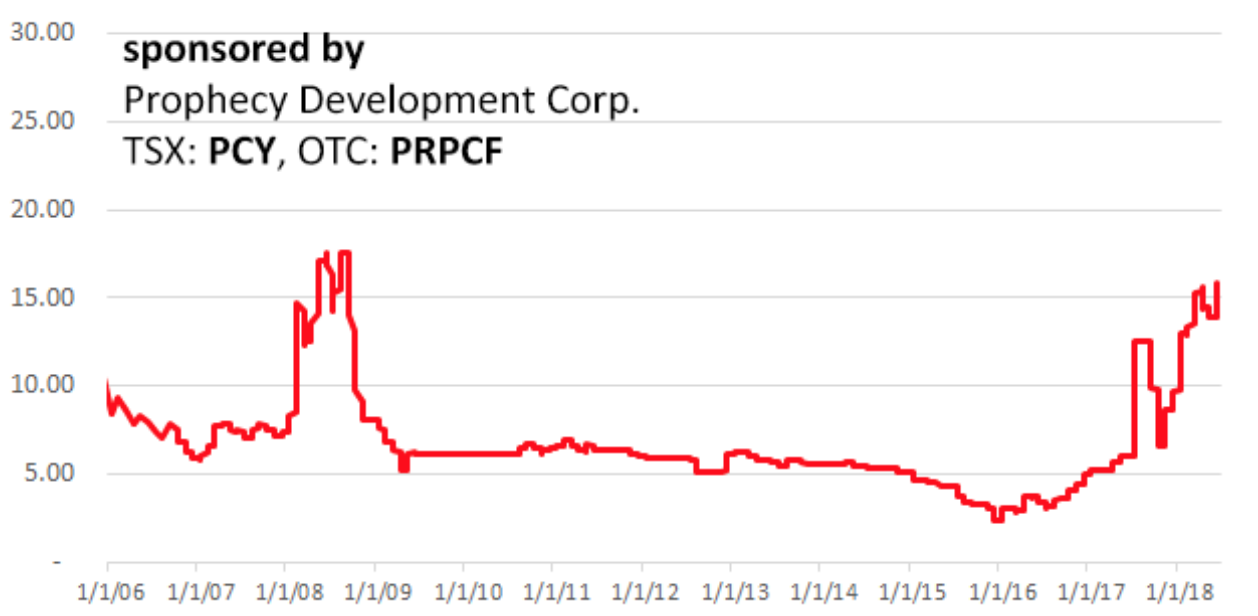
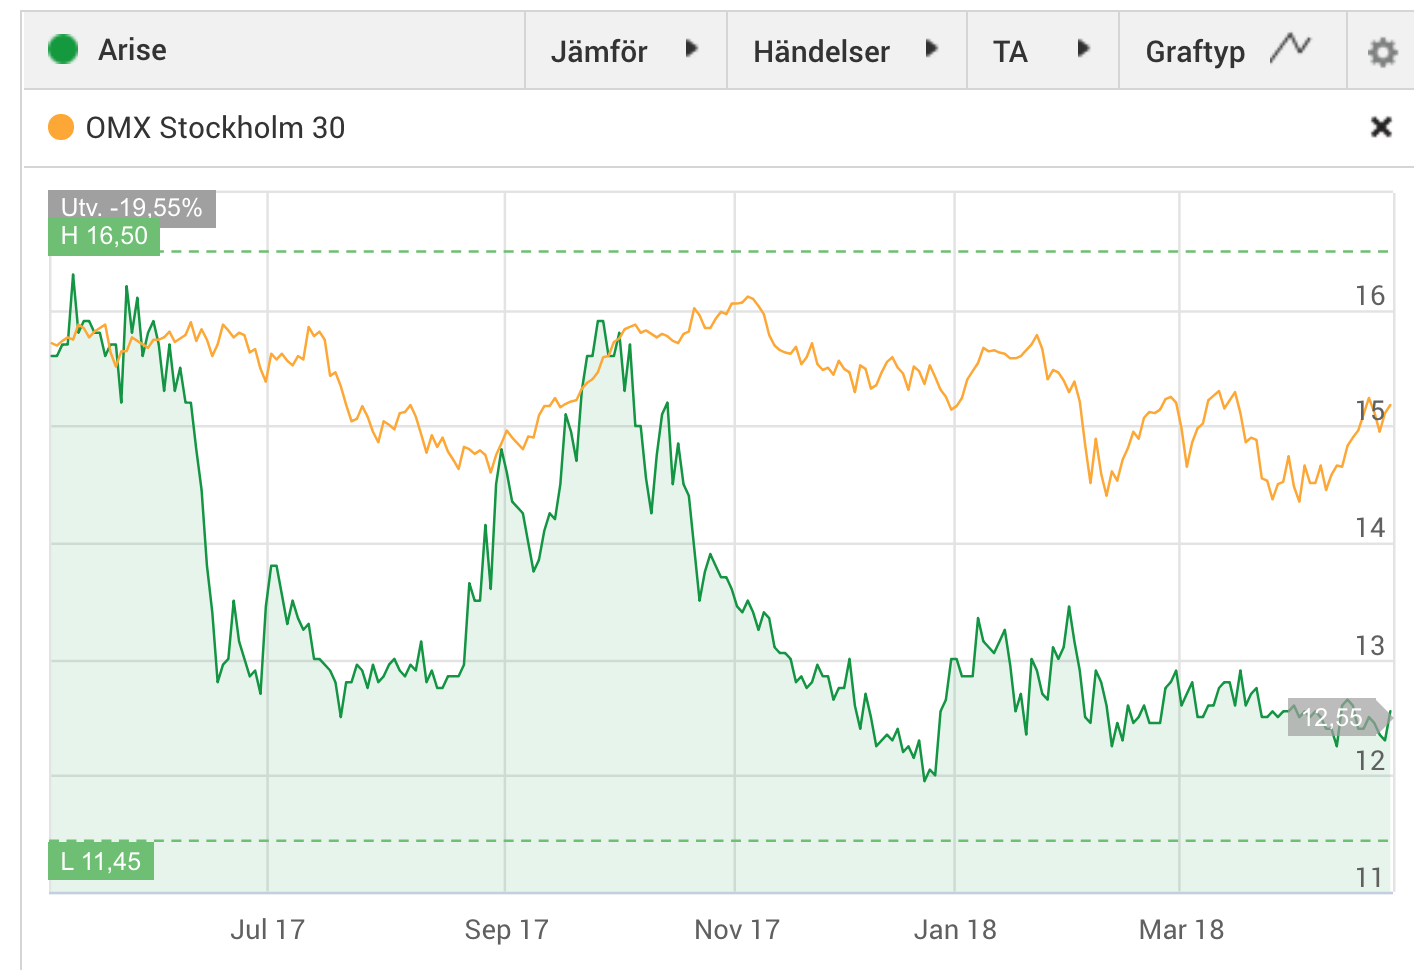
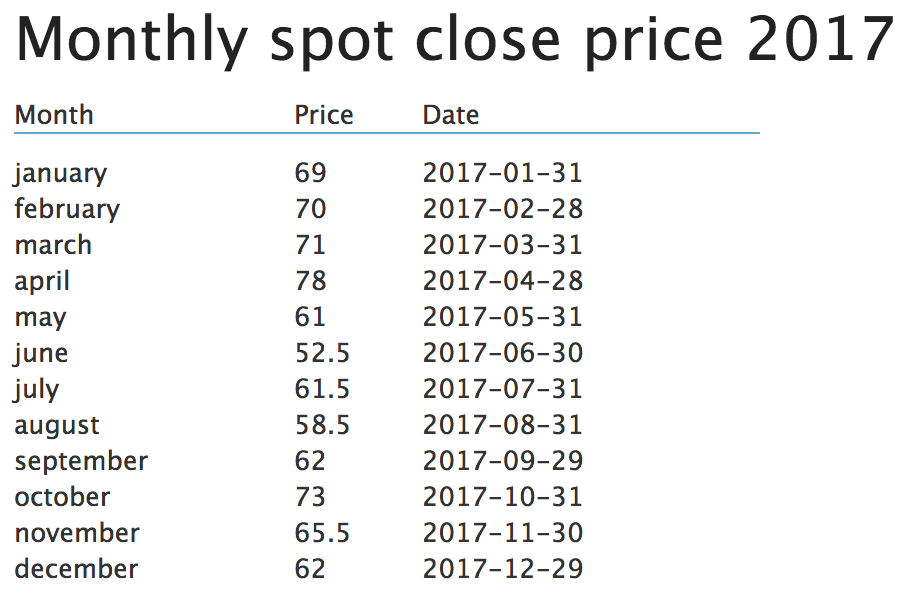
Oil prices are back but share prices are not
The virus led to a hard drop in oil prices, especially for WCS. But that has come back hard and is now above $50 per barrel, a level not seen since April 2019.

Back then the IPCO share price was above 50 SEK and now it lingers around 27 SEK. USD/SEK has declined by 10% over that period making up for a small portion of that = 30 SEK by comparison.
So oil truly is in the dumps, sentiment wise. However, free cash flow generation is not:
IPCO Valuation
At 27 SEK IPCO market cap is: $510M (USD)
Net debt after Q4: $320M. (EV: $830M)
Based on their 2021 production guidance (42,000 barrels per day) and capex guidance ($37M) (https://www.international-petroleum.com/investors/presentations/) I calculate free cash flow of $185M for 2021 given WCS $50 and Brent $65.
Normalized capex in the coming five years looks to be around $80Mish and production $46,000ish barrels of oil per day = FCF of about $180M given today’s oil prices. That equates to an EV/FCF below 5. So less than five years of free cash flow to pay down all debt and buy back all shares.
Very handsome FCF yields that are difficult to find elsewhere in the market. And if my oil thesis turns out to be correct those free cash flows will be improving over the coming years.
So what will IPCO do will all this cash?
Ressource companies have a tendency towards growth for the sake of growth, often at the expense of value per share. However, the Lundin companies have demonstrated again and again over the years that per share thinking permeates their culture.
IPCO has demonstrated a willingness to shrink the company via accretive buybacks when debt was manageable and the discount to net asset value was large. My sense from the recent Capital Markets Day from last week (https://edge.media-server.com/mmc/p/x8ykwcpj) is that this could be in the works again in about a year’s time when debt has come down to a more suitable level.
Caution now is the main focus after a tough 2020. As it is for pretty much everyone in the industry. Which is why supply is so constrained. And which again is why oil prices could meet little resistance on the way up even though Saudi and Russian oil will fill some of the gaps in the months to come. The larger question is whether they are able to further out in time, even 1-2 years from now.
IPCO has proven and probable reserves (2P) lasting 18 years. They also own a project, Blackrod, with potential for adding 3x of those reserves a few years down the road if oil prices stay elevated. That could potentially add 150% of production although it is doubtful IPCO can lift this project without a partner given the size of it. The valuation of this project is close to 0 currently among analysts. However, that could change in a big way in a higher price environment. Worth noting that the previous owners have already invested $180M into this project.
How about further acquisitions? Lots of struggling companies and majors that want to divest at cheap prices. Why not pick up the spoils on the side of the road? Frankly, I hope they don’t go down that route, even though it could potentially add more longer term value. I prefer to think that now is the time to harvest at as low risk as possible. Seems to me they have plenty of run way, especially with Blackrod in the pipeline, and a size that is adequate.
Conclusion
If my view that oil is heading towards Brent $70-$80 in the coming 2-3 years plays out and if we return to normalized valuation multiples the stock could easily 5x over that time frame.
At current oil prices I would expect at least a 2x over the coming year or two.
I would expect the truly long-term investors who are able to sit on their butt for 10-20 years to be collecting some fat dividends over that time period.
Supposing oil prices fall from here I think there is a lot of cushion built into the current share price. Also, the Saudis have demonstrated a willingness towards quick cuts (unilaterally even) in case demand wanes. That ought to keep a floor under the price. Given their own precarious economic situation I doubt they will be tempted to start yet another price war.
Disclaimer: I own shares in International Petroleum. If you become interested in the company based on this article please do your own due diligence before buying or selling shares in the company.